In an age where attention spans are shrinking and markets are flooding with competitors, businesses must find effective ways to communicate their message quickly and clearly. Visual communication—through design, graphics, infographics, and other visual tools—is not just a creative endeavor; it is a strategic necessity. When done correctly, visual design enhances understanding, boosts engagement, and improves decision-making for businesses, both internally and externally.
TLDR: Visuals can drastically improve how businesses communicate, both with customers and internally. When used effectively, they clarify complex ideas, make marketing more engaging, and streamline organizational processes. Strategic use of design helps turn raw data into actionable insight, and poor visual design can do the opposite—confuse and overwhelm. In today’s fast-paced digital world, good design isn’t just decoration; it’s communication.
The Role of Visuals in Business Communication
Visual elements play a key role in helping people understand and retain information. Research shows that people process visuals 60,000 times faster than text. Visuals can simplify complex concepts, highlight trends, and guide viewers to the most important parts of a message.
- Infographics can make heavy data easier to digest.
- Process diagrams clarify workflow, roles, and responsibilities.
- Charts and graphs reveal patterns in sales, user behavior, and efficiency metrics.
For internal teams, this means fewer misunderstandings and more informed decisions. For customers, it means easier engagement and faster trust-building.
Design and Customer Perception
The design of your website, product packaging, presentation slides, and marketing materials sends a message. That message, whether intentional or not, reflects your brand’s values, quality, and priorities. Inconsistent fonts or cluttered layouts can make a business look unprofessional or disorganized.
On the other hand, consistent and attractive design builds credibility and emotional connection. Companies like Apple and Nike have set high standards for how minimalist, sleek visuals can create a premium perception.
Effective visuals influence customer behavior by:
- Building trust through consistency and professionalism
- Improving clarity of offers and benefits
- Increasing conversion by guiding users through calls to action
Internal Benefits of Good Visual Communication
Visuals don’t only affect the outside world—they play a crucial role inside the organization as well. Whether it’s onboarding documents, team updates, or strategic presentations, strong visual design supports clear thinking and collaboration.
Consider the example of a company rollout plan. A document filled with paragraphs may lose your team’s attention before it even begins. Contrast that with a timeline graphic, key milestones highlighted in color-coded dashboards, and a set of icons for responsibilities. The difference in engagement and comprehension is dramatic.
Visuals inside a business are vital for:
- Clarifying goals and timelines
- Reinforcing values during onboarding
- Sharing KPIs in easily understandable formats
Visuals and Decision-Making
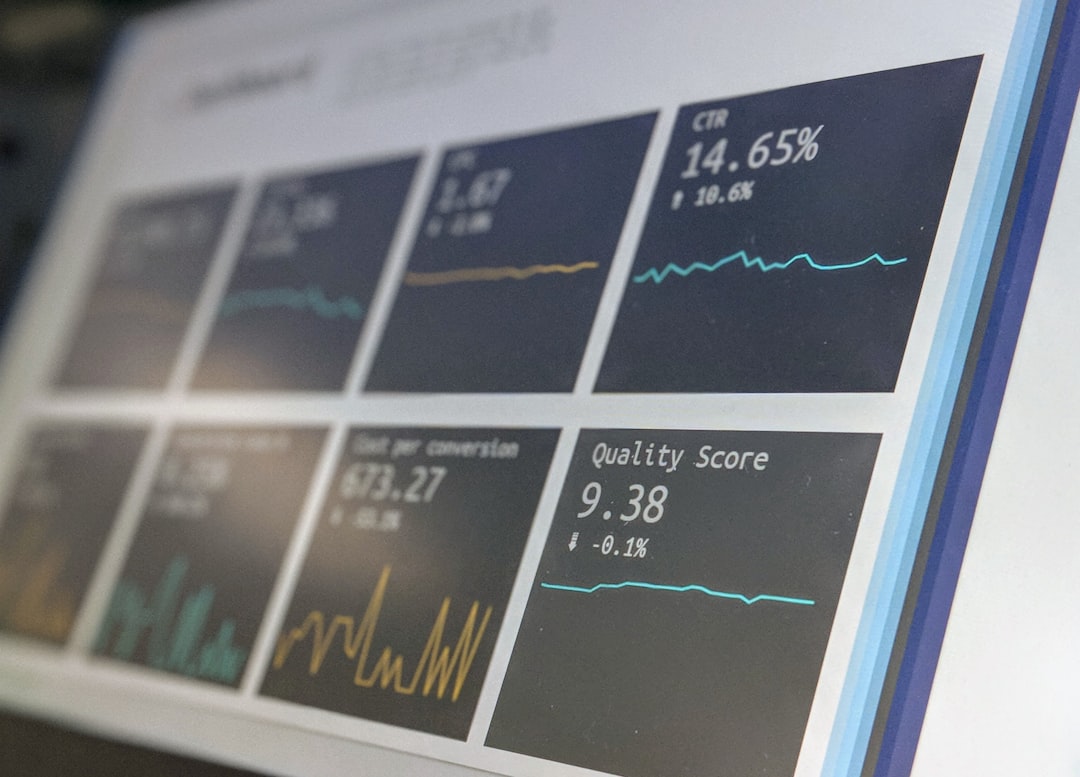
Business decisions often rely on large sets of quantitative and qualitative data. Presenting this information in raw formats like spreadsheets limits its impact. Visual storytelling with dashboards, graphs, color coding, and annotations helps decision-makers see patterns, compare scenarios, and make informed choices quickly.
Tools like Power BI, Tableau, or even visual dashboards in Excel empower leaders to cut through the noise. Design plays a crucial role here—too many colors, unnecessary animation, or ambiguous symbols can distract or mislead.
The keys to using visuals for decision-making are:
- Understand your audience – What decisions must they make?
- Present only relevant visuals – Less is often more.
- Use clear legends and labeling – Eliminate guesswork.
Design Consistency and Efficiency
Standardizing design elements across business materials can improve operational efficiency. Using a consistent style guide—think fonts, color palette, icon sets, and spacing rules—reduces the time spent on formatting and increases cohesion between departments and channels.
This consistency reinforces brand identity and also helps employees focus on content rather than presentation. Moreover, with templates and design systems, companies can ship high-quality marketing or internal documents faster.
Types of Effective Visual Tools in Business
It’s not about flashy graphics; it’s about choosing the right tools for the message. Here are some of the most useful visual formats businesses should consider:
- Infographics: Combine text and visuals to explain complex topics.
- Gantt Charts: Show project timelines and task dependencies.
- Process Maps: Break down workflows for training or analysis.
- Pictograms: Use icon-based communication for clarity across languages.
- Heat Maps: Visualize user engagement or sales concentration by location or behavior.
Common Mistakes in Business Visual Design
When visuals are misused, they can confuse or even mislead. To avoid common pitfalls, businesses should steer clear of:
- Overdesign: Too many colors, animations, and effects can overwhelm viewers.
- Unclear labeling: Data visuals must have legends, titles, or callouts.
- Inconsistent branding: Mismatched fonts or colors dilute credibility.
- Misuse of charts: For example, using pie charts for datasets that don’t represent parts of a whole.
Hiring or consulting with a professional designer can make a big difference in ensuring clarity and adherence to best practices.
Conclusion
Effective visuals are not just decoration; they are a core part of how businesses communicate, operate, and persuade. In both customer-facing campaigns and internal documentation, visual design helps simplify complexity and foster understanding. As markets evolve and attention spans continue to shrink, mastering visual communication can become a powerful competitive advantage.
FAQs
- Why are visuals important in business communication?
- Visuals help people understand and retain information more quickly. They make complex information more accessible and engaging for both customers and internal stakeholders.
- What are examples of effective business visuals?
- Examples include infographics, charts, dashboards, workflows, and process maps. These tools help simplify data and improve communication across teams.
- Can bad design hurt a business?
- Yes. Poorly executed visuals can confuse users, lessen brand credibility, and even result in bad decisions if data is misrepresented.
- Do small businesses also need good design?
- Absolutely. A well-designed pitch deck or social media post can help a small business compete with larger brands by effectively communicating trust and value.
- What tools are most helpful for creating business visuals?
- Tools like Canva, Adobe Illustrator, Power BI, Tableau, and even PowerPoint offer powerful ways to create and share business visuals efficiently.